by Brian Reyes, Carlos Daboin, and Greg Wright
Over the past year and a half labor markets have been unusually tight, with job openings per worker consistently trending upward and, more recently, spiking in July. The most recent October jobs report suggests that many of these openings may finally be filling, with employment rising in sectors—like Leisure and Hospitality—that have been experiencing the largest labor shortages. Nevertheless, labor markets remain historically tight, and our analysis described here indicates that it is mid-sized metropolitan areas that are experiencing the biggest squeeze.
The most commonly referenced measure of labor market tightness is the national figure produced by the Bureau of Labor Statistics’ (BLS) Job Openings and Labor Turnover Survey (JOLTS). Recently, there have been efforts to produce more sophisticated measures that address some of the shortcomings of the JOLTS measure. And in October JOLTS released a new series at the state level that allows for much-needed analysis of the geographic variation in worker shortages. Here we produce a complementary area-specific measure at the “commuting zone” (CZ) level, which is a geographic area that is intended to capture a region in which most inhabitants both live and work. CZs are sometimes referred to simply as labor markets and they are constructed as contiguous collections of counties.
The most common measure of labor market tightness is the ratio of unemployed workers (U) in an area to the number of job vacancies (V). To construct our version we begin with county job vacancies over the period April to July from EMSI-Burning Glass (EBG) online job postings data. In general, EBG data are reasonably representative of the universe of job postings, though they are somewhat skewed toward professional sectors and occupations, and away from relatively low-wage sectors and occupations, which are less often posted online. However, when aggregated to the state level we find that EBG job postings are highly correlated with JOLTS state-level postings data, which encompass both on- and off-line postings.
We then use county-level unemployment data from the BLS Local Area Unemployment Statistics as our values for U. Finally, we aggregate V and U across 741 CZs and take the ratio of the two for each CZ to obtain CZ-specific U/V ratios.
The Tightest Labor Markets are Associated with Mid-Sized Metros
Each CZ can also be linked to the major metropolitan areas that they encompass, and so we refer to the CZs by their associated metro areas.
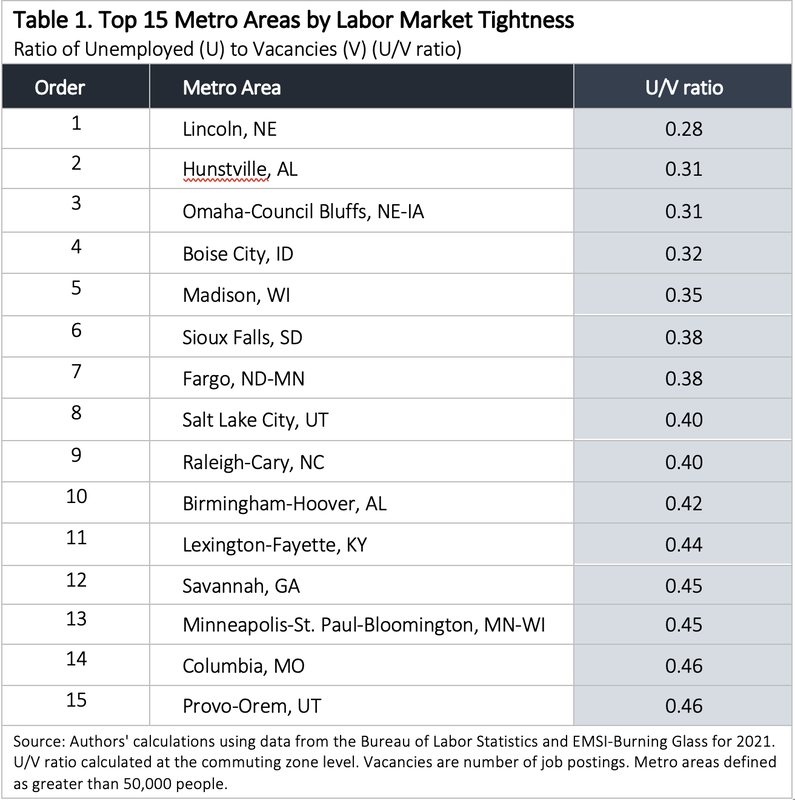
Table 1 below highlights our main finding: the top 15 tightest labor markets are all mid-sized metros. At the top, the Lincoln (NE) labor market has nearly 4 job openings for every unemployed (job-seeking) person, and the 15th ranked Provo-Orem (UT) labor market has just over 2 openings per unemployed worker. We note that these findings are consistent with the state-level measures from JOLTS, which highlight that the states with the tightest labor markets are less-populated, non-coastal states.
Over the past year and a half labor markets have been unusually tight, with job openings per worker consistently trending upward and, more recently, spiking in July. The most recent October jobs report suggests that many of these openings may finally be filling, with employment rising in sectors—like Leisure and Hospitality—that have been experiencing the largest labor shortages. Nevertheless, labor markets remain historically tight, and our analysis described here indicates that it is mid-sized metropolitan areas that are experiencing the biggest squeeze.
The most commonly referenced measure of labor market tightness is the national figure produced by the Bureau of Labor Statistics’ (BLS) Job Openings and Labor Turnover Survey (JOLTS). Recently, there have been efforts to produce more sophisticated measures that address some of the shortcomings of the JOLTS measure. And in October JOLTS released a new series at the state level that allows for much-needed analysis of the geographic variation in worker shortages. Here we produce a complementary area-specific measure at the “commuting zone” (CZ) level, which is a geographic area that is intended to capture a region in which most inhabitants both live and work. CZs are sometimes referred to simply as labor markets and they are constructed as contiguous collections of counties.
The most common measure of labor market tightness is the ratio of unemployed workers (U) in an area to the number of job vacancies (V). To construct our version we begin with county job vacancies over the period April to July from EMSI-Burning Glass (EBG) online job postings data. In general, EBG data are reasonably representative of the universe of job postings, though they are somewhat skewed toward professional sectors and occupations, and away from relatively low-wage sectors and occupations, which are less often posted online. However, when aggregated to the state level we find that EBG job postings are highly correlated with JOLTS state-level postings data, which encompass both on- and off-line postings.
We then use county-level unemployment data from the BLS Local Area Unemployment Statistics as our values for U. Finally, we aggregate V and U across 741 CZs and take the ratio of the two for each CZ to obtain CZ-specific U/V ratios.
The Tightest Labor Markets are Associated with Mid-Sized Metros
Each CZ can also be linked to the major metropolitan areas that they encompass, and so we refer to the CZs by their associated metro areas.
Table 1 below highlights our main finding: the top 15 tightest labor markets are all mid-sized metros. At the top, the Lincoln (NE) labor market has nearly 4 job openings for every unemployed (job-seeking) person, and the 15th ranked Provo-Orem (UT) labor market has just over 2 openings per unemployed worker. We note that these findings are consistent with the state-level measures from JOLTS, which highlight that the states with the tightest labor markets are less-populated, non-coastal states.